Benchmark Insights Dashboard
This dashboard shows you how your site compares to other Yottaa sites in metrics like conversion rate, bounce rate, and session depth. Use the drop-down at the top of the page to see data for different communities.
To refresh the dashboard, download the dashboard data, or schedule delivery of a dashboard report, click  at the top right of the dashboard and click an option.
|
Option |
Description |
||||||||||||||||||
|---|---|---|---|---|---|---|---|---|---|---|---|---|---|---|---|---|---|---|---|
|
Clear cache and refresh |
Clears your browser cache and refreshes dashboard data. |
||||||||||||||||||
|
Download |
Downloads data as PDF or CSV file. For PDF downloads, the following additional options are available.
|
||||||||||||||||||
|
Schedule delivery |
|
sftp://192.168.0.10/Marketing/In/
This example URL ends with the / character, indicating that the file will be saved in a folder named In. If you leave out the trailing /, the file will be saved in the Marketing folder, and "In" will be prepended to the filename.
Details for Preferred key exchange algorithm: If the connection is not established within five minutes, choose a different algorithm. Some algorithms take a long time to generate an SSH key. This option lets you use an algorithm that might take less time. Choosing one of the algorithms makes it the preferred algorithm for establishing the SSH connection. If the algorithm is not supported by the server, all the other algorithms are used in subsequent attempts. When this field is set to Default, the original order of algorithms in the connection library is used.
To view the  Alerts icon at the top right corner of a tile on the dashboard, hover your cursor on the tile. To create a new alert, enter information in the dialog as described below.
The alerts you create here are not anomaly alerts. For more information about anomaly alerts, see Security Anomaly Alerts.
|
Alert Title |
Unique name for the alert you are creating. To enter a title, click on the editable text field at the top of the dialog, enter text, and then press Enter. |
|
Condition |
Condition that triggers an alert notification.
|
|
Where to send it |
The destination for the alert.
|
|
Frequency |
You can set the frequency at which Yottaachecks your data for changes (and sends an alert notification if the alert conditions are met). The default frequency is Daily at 05:00. These are the available frequency options:
Start and End times are inclusive. For example, if you choose to check every 12 hours with a Start time of 05:00 and an End time of 17:00, Yottaa checks the data at 05:00 and 17:00. |
To view the icon for the Tile Actions menu at the top right corner of a tile on the dashboard, hover your cursor on the tile. The options available vary depending on the data and format of the tile. All of the possible options are described below.
|
Option |
Description |
||||
|---|---|---|---|---|---|
|
Download data |
Downloads data in a variety of file formats. You can either download the file (recommended) or view it in your browser. Advanced data options are also available for all formats except PNG. |
||||
|
Autosize all columns |
Sizes the width of each column to fit its column heading name or its longest data value, whichever is wider. Available only for tiles that display data in table format. |
||||
|
Reset all column widths |
Resizes each column to its default width. Available only for tiles that display data in table format. |
||||
|
View |
|
||||
|
Clear cache and refresh |
Clears your browser cache and refreshes dashboard data. |
Key Insights at Top of Dashboard
|
Example |
Option |
Description |
|---|---|---|
|
|
Sessions |
Shows the total number of sessions |
|
|
Conversion Rate |
Shows the rate at which sessions ended in a conversion for the selected community and for your site. Conversion data is not available for every site. To set up conversion insights for your site, contact Yottaa Customer Success. |
|
|
Bounce Rate |
Shows the rate at which sessions ended after only one page view for the selected community and for your site. |
|
|
Session Depth |
Shows the average number of pages viewed per session for the selected community and for your site. |
|
|
Page Load Time |
Shows the average onload time |


Site Speed Impact
For the graphs in this session, click the graph legend to display the desired data set.
|
Example |
Option |
Description |
||||
|---|---|---|---|---|---|---|
|
|
Site Speed Impact on Conversion Rate |
In this graph, each bar represents the conversion rate |
||||
|
|
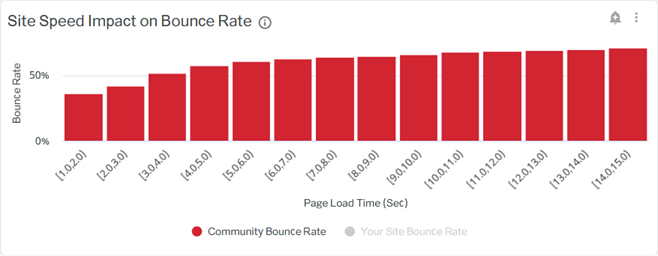
Site Speed Impact on Bounce Rate |
In this graph, each bar represents the bounce rate |
||||
|
|
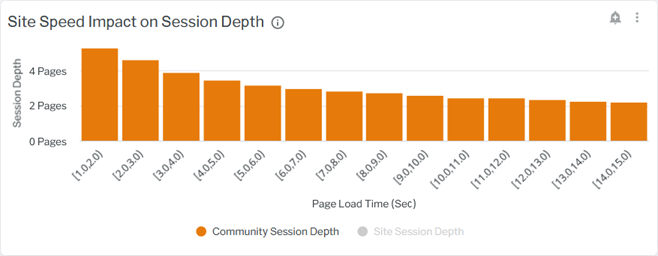
Site Speed Impact on Session Depth |
In this graph, each bar represents the session depth for sessions that fall within a range of average page load times for both your site and the selected community. Each bar represents an equal number of sessions. Move the mouse over the bars to see further details. |
||||
|
|
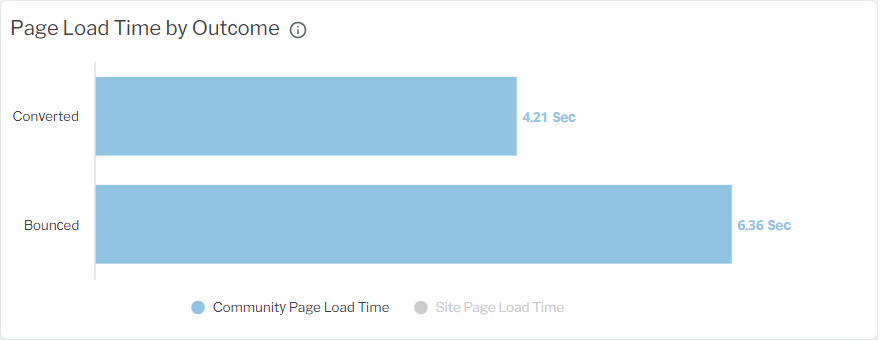
Page Load Time by Outcome |
Shows the average page load time for each session outcome for the selected community. The outcomes include:
|
||||
|
|
Sessions and Conversion Rate by Page Load Time |
Shows the percent of sessions that fell within each page load time range and the associated conversion rate. Each bar represents the percent of sessions for a page load time range. The conversion rate is represented by a line. |


Optimization Impact on Community Sites
|
Example |
Option |
Description |
|---|---|---|
|
|
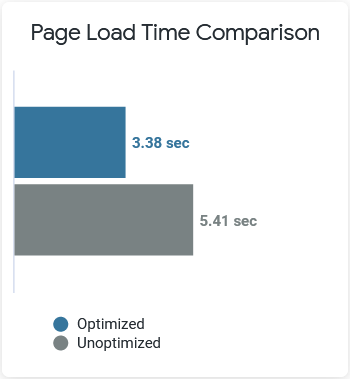
Page Load Time Comparison |
Shows the average optimized and unoptimized page load time for the selected community. |
|
|
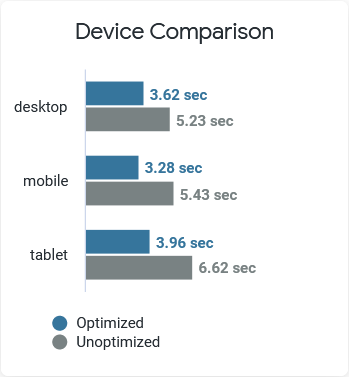
Device Comparison |
Shows the average optimized and unoptimized page load time on each device type for the selected community. |
|
|
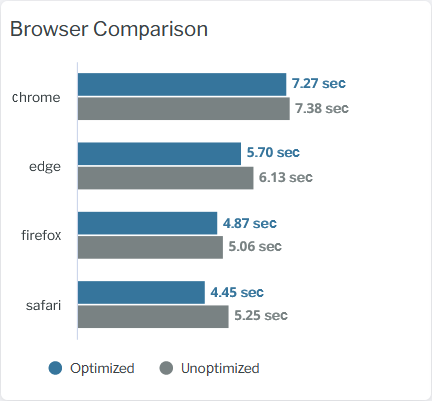
Browser Comparison |
Shows the average optimized and unoptimized page load time on each browser for the selected community. |
|
|
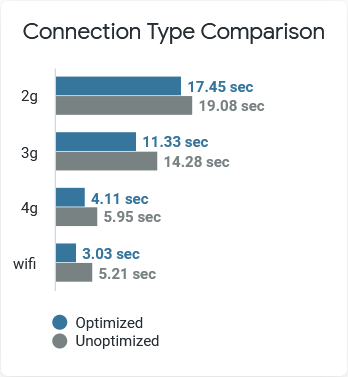
Connection Type Comparison |
Shows the average page load time for each connection speed for the selected community. |
Community and Your Site Comparisons
|
Example |
Option |
Description |
|---|---|---|
|
|
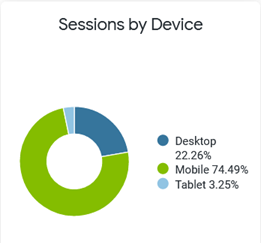
Sessions by Device (Community) |
Shows the percent of sessions that occurred on each device for the selected community. |
|
|
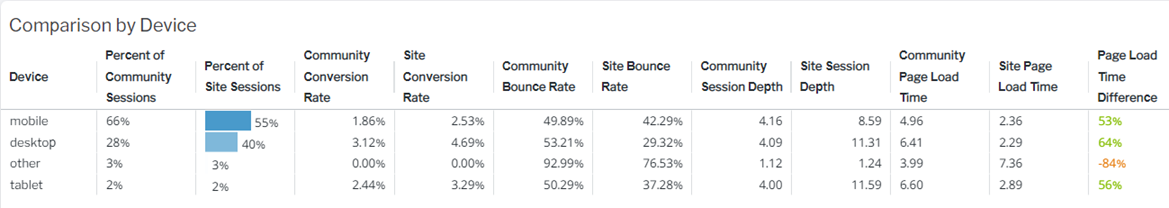
Comparison by Device |
Shows how your conversion rate, bounce rate, session depth, and page load time compare to the selected community for each device type. |
|
|
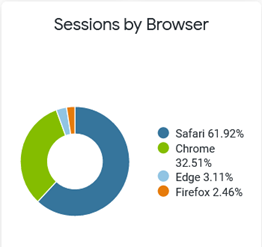
Sessions by Browser (Community) |
Shows the percent of sessions that occurred on each browser for the selected community. |
|
|
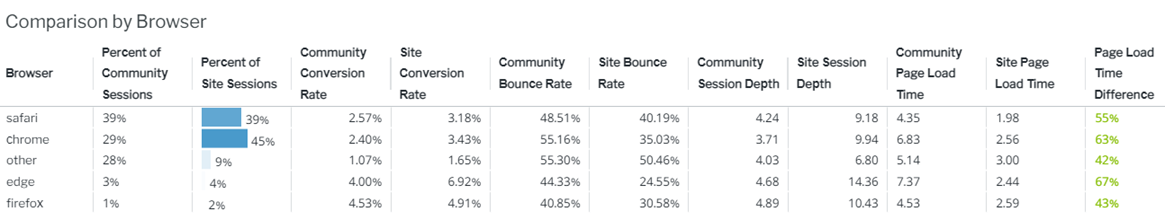
Comparison by Browser |
Shows how your conversion rate, bounce rate, session depth, and page load time compare to the selected community for each browser. |
|
|
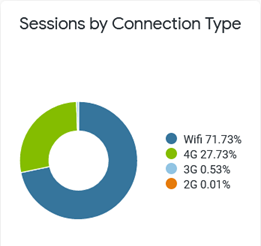
Sessions by Connection Type (Community) |
Shows the percent of sessions that occurred for each connection speed for the selected community. |
|
|
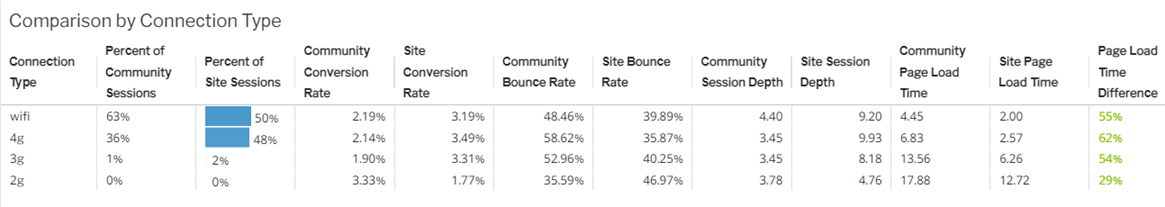
Comparison by Connection Type |
Shows how your conversion rate, bounce rate, session depth, and page load time compare to the selected community for each connection speed. |
Community Trends
|
Example |
Option |
Description |
|---|---|---|
|
|
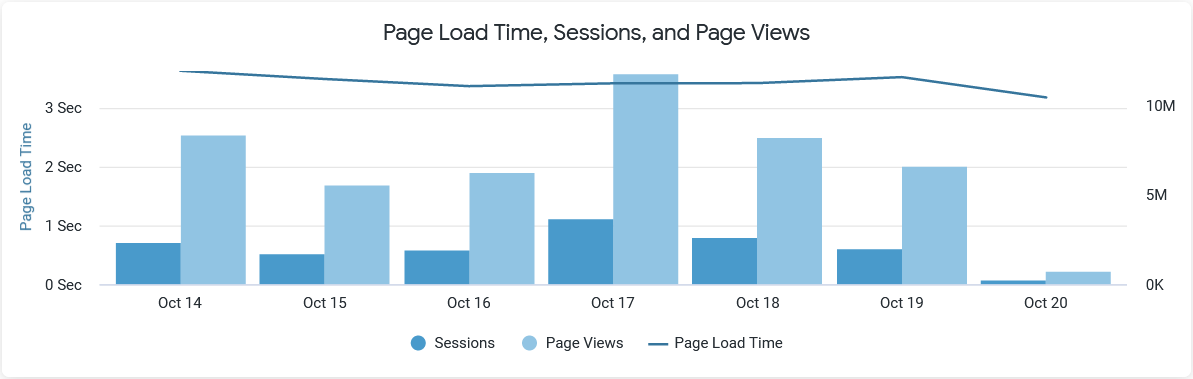
Page Load Time, Sessions, and Page Views |
Shows how the page load time, number of sessions, and number of page views has changed over time for the selected community. The line represents page load time, with the graph legend on the left. The bars show sessions and page views, with the graph legend on the right. |
|
|
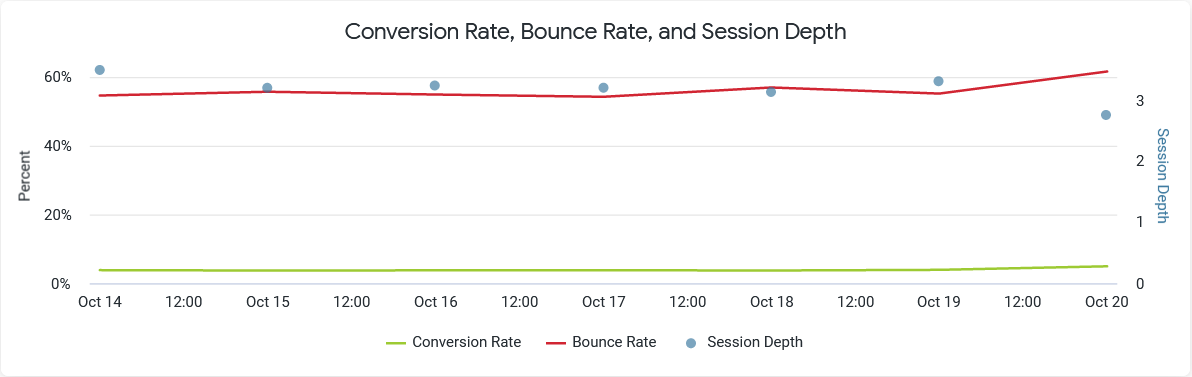
Conversion Rate, Bounce Rate, and Session Depth |
Shows how conversion rate, bounce rate, and session depth have changed over time for the selected community. The dots represent session depth with the legend on the right, and the lines show conversion rate and bounce rate, with the legends on the left. |